It’s been an exciting journey since we first introduced Salesforce Code Analyzer, our code scanning product that’s free for all Salesforce Developers. Our goal has always been to provide you with a powerful tool to build secure, high-quality solutions on the Salesforce Platform. Today, we’re thrilled to announce that Salesforce Code Analyzer v5 is now generally available — and it’s a game-changer.
We’ve rebuilt it from the ground up to be more modular, extensible, and configurable than ever before. Whether you work in the CLI, your favorite IDE, or within a CI/CD pipeline, Code Analyzer v5 is designed to seamlessly integrate into your development lifecycle, helping you identify issues early and enforce best practices.
If you’re a Salesforce Developer, Architect, or AppExchange Partner, this post is for you! We’ll get you set up with Code Analyzer v5, dive deep on how to customize it to your team’s needs, and wrap up with its powerful CI/CD integration.
What is Salesforce Code Analyzer v5?
Salesforce Code Analyzer v5 is a comprehensive, open-source tool designed to help you ensure that your code is secure, maintainable, and performant. It unifies multiple, best-of-breed analysis engines — including PMD (for Apex), ESLint (for JavaScript), RetireJS, a new Regex engine, and a Flow Scanner — under a single, easy-to-use interface, available across a range of experiences for both individual developers and teams.
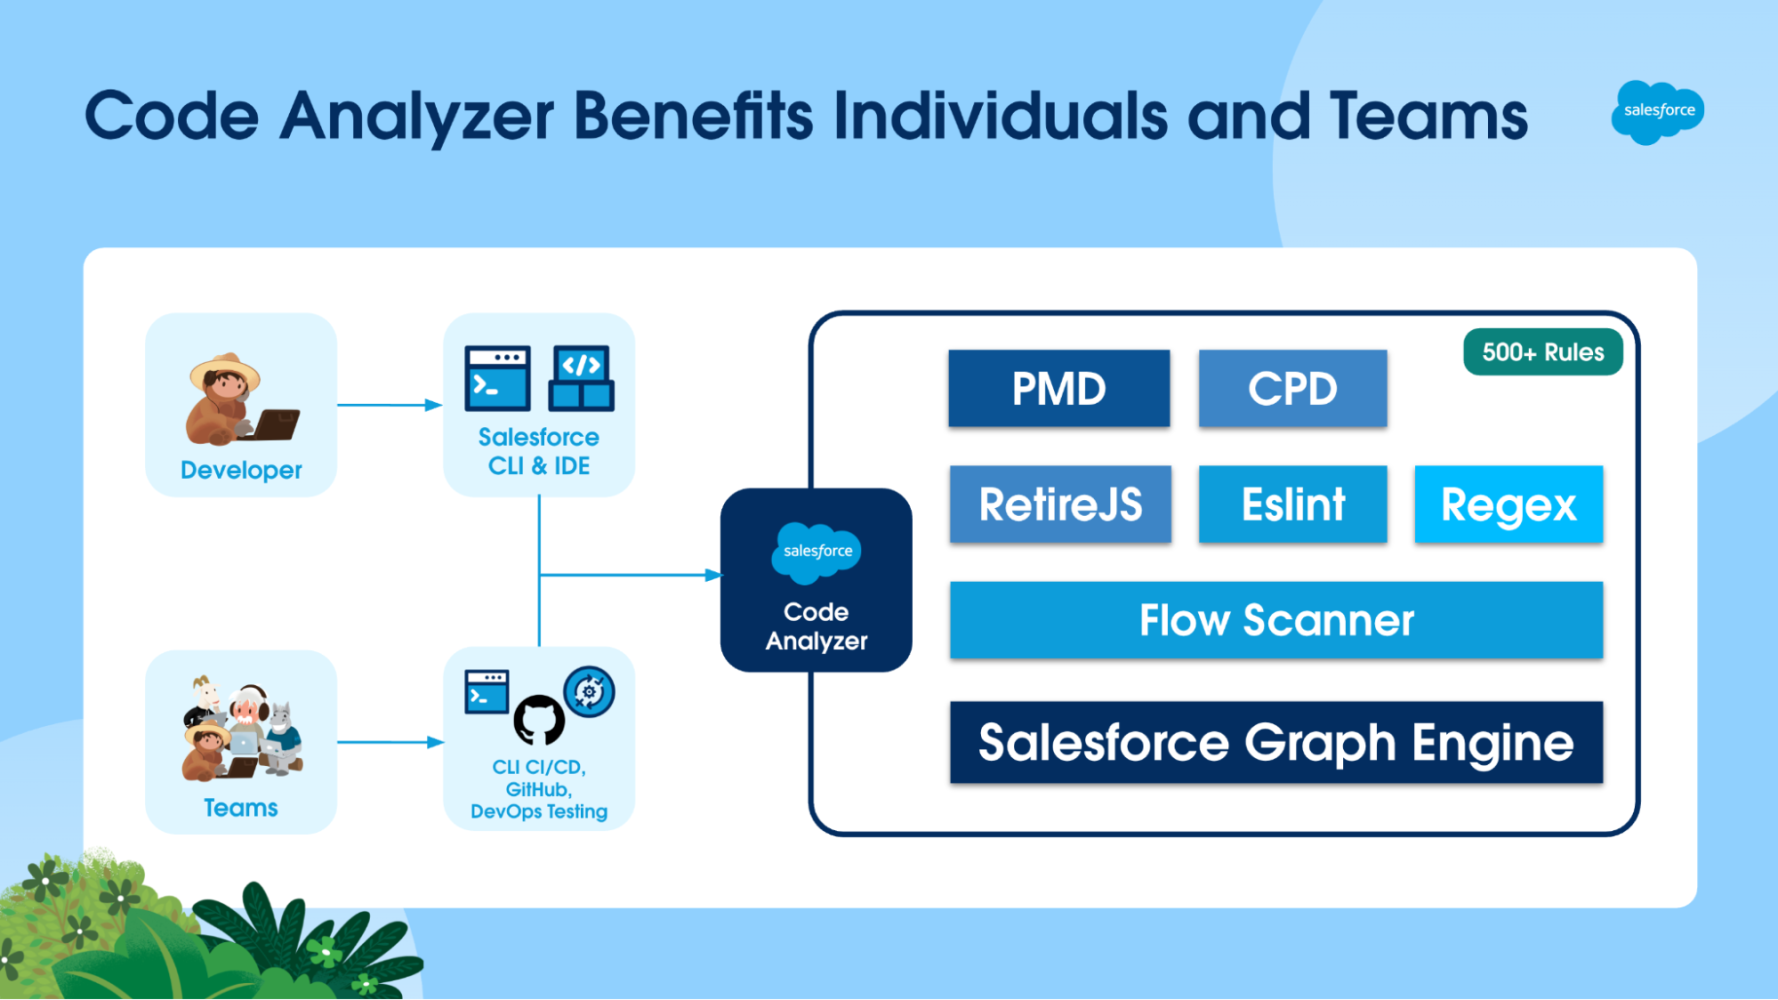
The true power of v5 lies in its new architecture. Everything is driven by a simple, yet powerful YAML configuration file (code-analyzer.yml), putting you in complete control of your code quality standards.
How to get started
Ready to dive in? It only takes a few minutes.
Install the Code Analyzer CLI plugin and VS Code extension
- Install/update the Salesforce CLI: Ensure that you have the latest version of the Salesforce CLI.
sf update
- Install the Code Analyzer plugin.
sf plugins install code-analyzer
- Run your first scan: New users can easily get started without any complex configuration. Simply run the command below in your project directory. This will automatically use the default set of Recommended rules, which have been handpicked by Salesforce to best suit general Salesforce development.
sf code-analyzer run
- Install the VS Code extension: We recommend installing the Salesforce Extension Pack for VS Code, as it has both Code Analyzer and Agentforce for Developers extensions. The extension pack is already installed if you’re using Code Builder. That’s all you need to get real-time feedback and quick-fixes on your code.
Discover available rules
To get the most out of Code Analyzer, you need to know what’s available beyond our Recommended ruleset. The Code Analyzer CLI plugin provides a powerful command to explore all the rules across every engine.
You can list all Recommended rules by running:
sf code-analyzer rules
But the real power comes from the --rule-selector flag, which lets you filter the list.
- List all rules: To list every single rule available, use:
sf code-analyzer rules --rule-selector all
- Filter by engine: To see only ESLint rules, use:
sf code-analyzer rules --rule-selector eslint
- Filter by category: To see all rules in the “Security” category across all engines, use:
sf code-analyzer rules --rule-selector Security
- Combine filters: To find only PMD rules in the “Performance” category, use:
sf code-analyzer rules --rule-selector pmd:Performance
Using these commands, you can easily find the exact rules you need to enable, disable, or override in your code-analyzer.yml file. More on this later on.
Once you know which rules you want to run, you can use exactly the same --rule-selector flag to invoke the sf code-analyzer run command:
sf code-analyzer run --rule-selector pmd:1 --rule-selector eslint:2
In this example, Code Analyzer will run all PMD rules with severity level 1 (Critical), as well as all rules for the ESlint engine with severity level 2 (High).
Apply quick fixes with the IDE integration
We know you spend most of your time in your IDE. That’s why we’ve supercharged the Salesforce Code Analyzer extension for VS Code, available as part of the Salesforce Extension Pack. It provides real-time feedback and, for the first time and via our Agentforce for Developers integration, it offers Quick Fixes for many common violations. Currently, we support quick fixes for a number of Apex PMD rules, and we’ll keep expanding over the coming months.
Here’s an example. It’s a best practice for architectural and code readability considerations to avoid deeply nested if statements. In some situations, Code Analyzer can use Agentforce for Developers to fix this code.
Code with a violation:
public void myMethod() {
    if (condition1) {
        if (condition2) {
            if (condition3) {
                // logic
            }
        }
    }
}
The IDE will highlight the deeply nested condition.
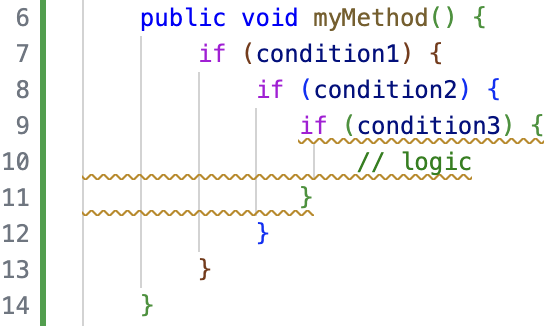
By right-clicking the violation directly in code or, alternatively, in the Problems panel, you get the option to quick fix and select Agentforce for Developers.
![]()
Agentforce for Developers generates the suggested fix, which you can then accept or reject.
Code after fix is applied:
public void myMethod() {
     if (condition1 && condition2 && condition3) {
         // logic
     }
}
This helps you learn and enforce best practices without disrupting your flow.
Advanced customization with a configuration file
For power users who want to fine-tune their code analysis, customizing the code-analyzer.yml file is the way to go. It allows you to precisely define which rules to run, customize engine behavior, and even register your own custom rules. This means you can create a tailored analysis process that perfectly fits your team’s standards.
Let’s walk through how you can customize it.
Generate a baseline configuration
To get started with customization, the easiest first step is to generate a baseline code-analyzer.yml file. This gives you a complete template with all the default settings, which you can then edit to fit your needs.
Run the following command in your terminal at the root of your project:
sf code-analyzer config
This command creates a new code-analyzer.yml file in your current directory. By default, this command creates a clean configuration file that doesn’t include rules that are running with their default values. This keeps the file from being unnecessarily large.
However, if you want to see every rule and its default setting in your generated file, you can add the --include-unmodified-rules flag. This is useful if you want a complete reference of all available settings to start from.
sf code-analyzer config --include-unmodified-rules
We recommend that you only include the rules that you want to override in your configuration file. This is especially important if you’re using other engine-specific configurations (such as a PMD XML ruleset), because Code Analyzer prioritizes the values in the code-analyzer.yml file. Keeping your configuration file lean ensures there are no unintended overrides and that your different configuration sources work together as expected.
Define a company-wide ruleset
A powerful feature of the YAML configuration is the ability to define a standard set of rules that everyone in your organization adheres to. You can create a custom tag, assign it to a curated list of rules, and even adjust their severity levels to match your company’s priorities.
For example, let’s create a standard ruleset for “Acme Corporation.” We’ll tag several critical security and performance rules under the rules section with the acme-corp-standard custom tag and define their severity. This ensures that every developer runs the same essential checks.
rules:
  pmd:
    # High-severity security rules
    ApexCRUDViolation:
      severity: 1 # Critical
      tags: ["acme-corp-standard"]
    ApexSOQLInjection:
      severity: 1 # Critical
      tags: ["acme-corp-standard"]

    # Moderate-severity performance rule
    AvoidSoqlInLoops:
      severity: 2 # High
      tags: ["acme-corp-standard"]

    # Low-severity code style rule
    UnusedMethodRule:
      severity: 3 # Moderate
      tags: ["acme-corp-standard"]
Create custom rules with Regex
Sometimes, you need to enforce conventions that are unique to your project. The Regex engine is perfect for this. For example, let’s say you want to flag any hardcoded Salesforce IDs in your code.
For example, you can add this as a custom HardcodedId rule directly in your YAML file under the engines section and tag it to include it in your company’s acme-corp-standard standard ruleset.
engines:
  regex:
    custom_rules:
      HardcodedId:
        regex: "\b[a-zA-Z0-9]{15}(?:[a-zA-Z0-9]{3})?\b"
        file_extensions: [".cls", ".trigger", ".js"]
        description: "Hardcoded Salesforce ID found. Use a Custom Label or Custom Setting."
        violation_message: "Hardcoded Salesforce ID found. Consider using a Custom Label or Custom Setting."
        severity: 2 # High
        tags: ["acme-corp-standard"]
Run scans with custom tags
With your configuration file in place, any developer at Acme Corporation can now run a scan against the company standard ruleset with a simple command using the --rule-selector flag and the custom tag.
To see the results, you can generate an HTML report at the same time.
sf code-analyzer run --rule-selector acme-corp-standard --output-file "report.html"
This command will execute all rules (both built-in and custom Regex) that have the acme-corp-standard tag and output the findings into an interactive HTML file.
Visualize results with rich HTML reports
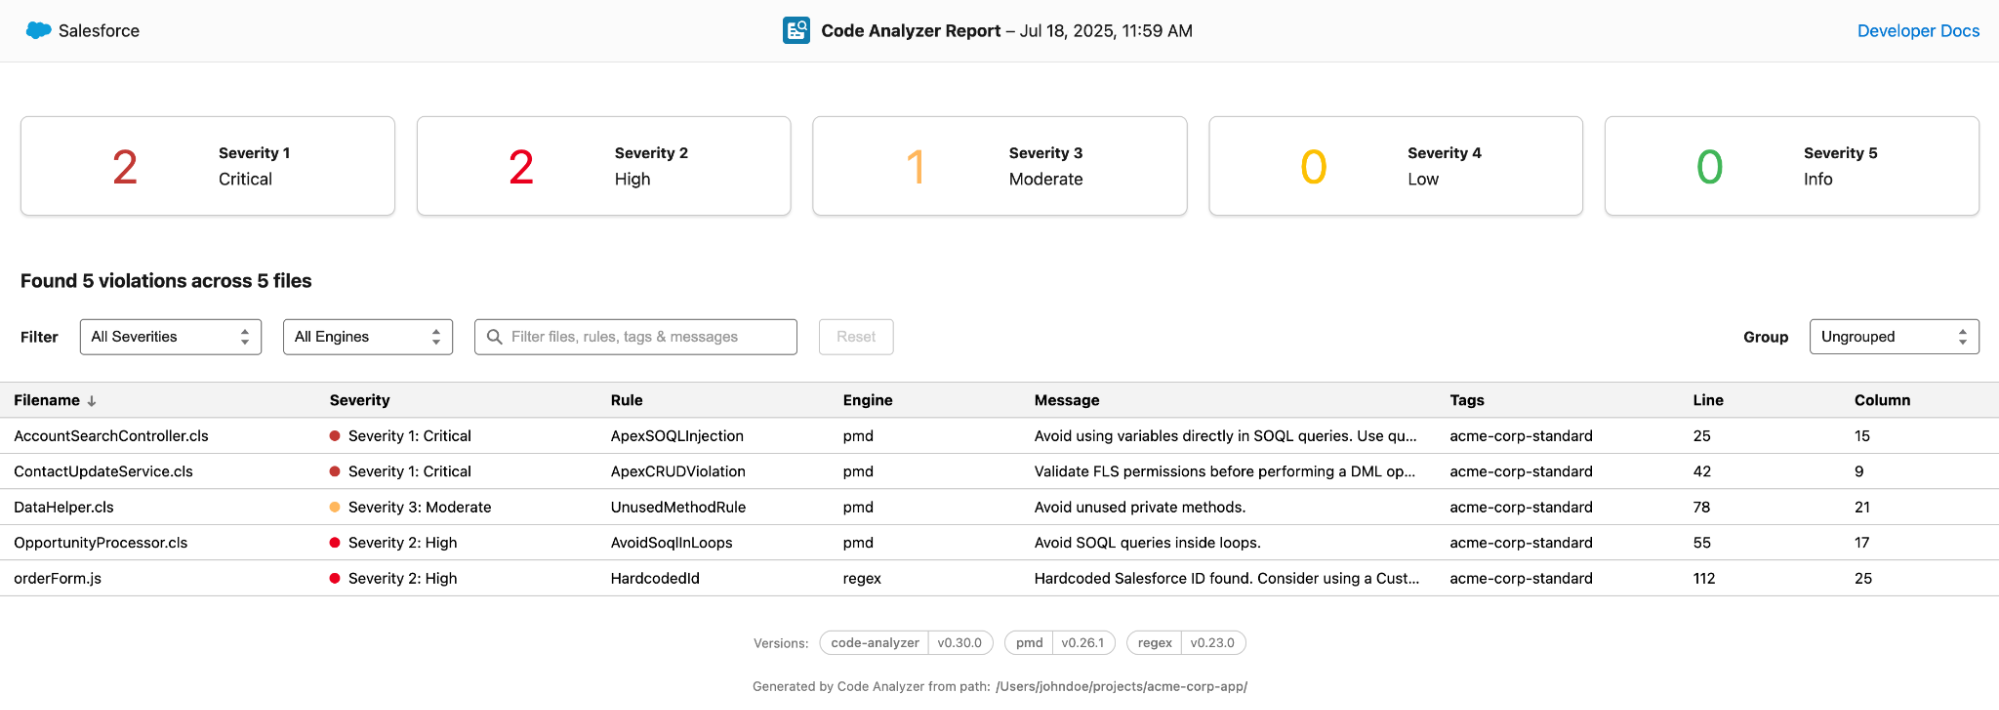
Understanding your scan results is just as important as running the scan itself. Code Analyzer v5 introduces a brand-new, interactive HTML report that makes it easy to browse, filter, and understand violations.
The report UI gives you a high-level summary of violations by severity and allows you to:
- Filter and search: Interactively filter violations by severity, engine, or a text search across files, rules, tags, and messages.
- Group and sort: Group the results by filename, rule, severity, or engine to better organize the findings. You can also sort by any column.
- Drill down into details: Click on any violation to open a detailed panel with the full message, file path, line number, and links to relevant documentation to help you fix the issue.
This rich, navigable format is perfect for sharing results with your team and tracking progress over time.
Integrating with CI/CD for automated quality gates
Code quality is a team sport. Code Analyzer v5 is designed for automation and integrates directly into your CI/CD pipelines. To make this even easier, we provide an official Salesforce Code Analyzer GitHub Action.
This action simplifies your workflow by handling the installation of the CLI plugin and all its dependencies. You just need to tell it what to run. Once it runs, it provides you with a summary of violations directly in GitHub.
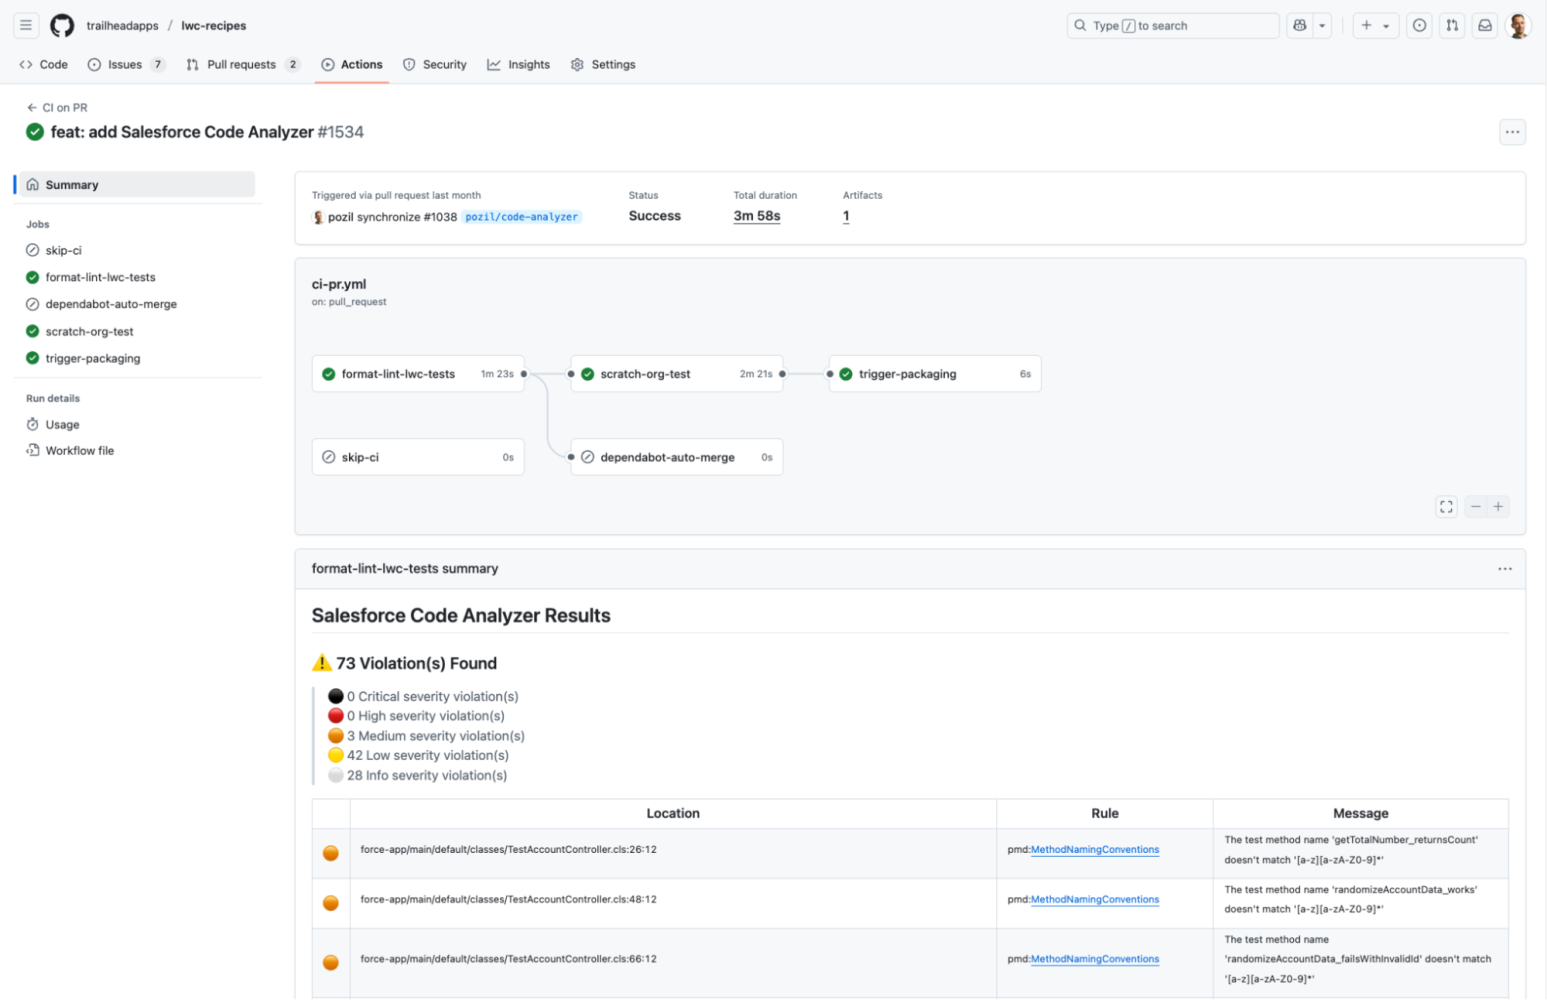
Here is an example of a GitHub Actions workflow that runs the scanner, fails the build if there are more than 10 violations (or any sev1 or sev2 violations), and generates results in both HTML and JSON format:
- name: Run Salesforce Code Analyzer
        id: run-code-analyzer
        uses: forcedotcom/run-code-analyzer@v2
        with:
          run-arguments: --workspace . --view detail --output-file sfca_results.html --output-file sfca_results.json
          results-artifact-name: salesforce-code-analyzer-results
          github-token: ${{ github.token }}

      - name: Check the Outputs to Determine Whether to Fail
        if: |
          steps.run-code-analyzer.outputs.exit-code > 0 ||
          steps.run-code-analyzer.outputs.num-sev1-violations > 0 ||
          steps.run-code-analyzer.outputs.num-sev2-violations > 0 ||
          steps.run-code-analyzer.outputs.num-violations > 10
        run: exit 1
You can see a more comprehensive example as part of a real-life CI workflow in our LWC Recipes sample app.
In addition, Code Analyzer is available in DevOps Testing. This means you can easily integrate it as part of your workflow with DevOps Center. With DevOps Testing, you can run not only Code Analyzer, but also a variety of other Salesforce and Partners tools, as well as define quality gates, to ensure all solutions are thoroughly tested before they hit production.
Conclusion
Salesforce Code Analyzer v5 is more than an update; it’s a fundamental step forward in empowering developers to write high-quality code efficiently. Its flexible architecture, deep analysis capabilities, and seamless toolchain integration help you catch issues early, reduce deployment risks, and pass security reviews with confidence.
Embrace the power of Salesforce Code Analyzer v5 and take your development practices to the next level — faster, smarter, and more secure than ever before.
Resources
- Salesforce Code Analyzer documentation
- Salesforce Code Analyzer GitHub Action
- Salesforce Code Analyzer VSCode Extension
- LWC Recipes Sample App
About the author
John Belo is Director, Product Management for Developer Experience Products, leading the Application Lifecycle Management product space within the team. He oversees products such as Salesforce Code Analyzer v5, DX Inspector, DevOps Center, DevOps Testing, AppExchange App Analytics, and Package Migrations. He’s been with Salesforce for ten years and spent the majority of this time within the AppExchange team. He started by leading a team of ISV Technical Evangelists in EMEA, and is now part of the Developer Experience Product Management team, helping developers to deliver quality solutions faster than ever before.
The post Elevate Your Team’s Code Quality with Salesforce Code Analyzer v5 appeared first on Salesforce Developers Blog.


