
Google is bringing Gemini into Google Ads dashboards, aiming to make data analysis more interactive, visual and accessible.
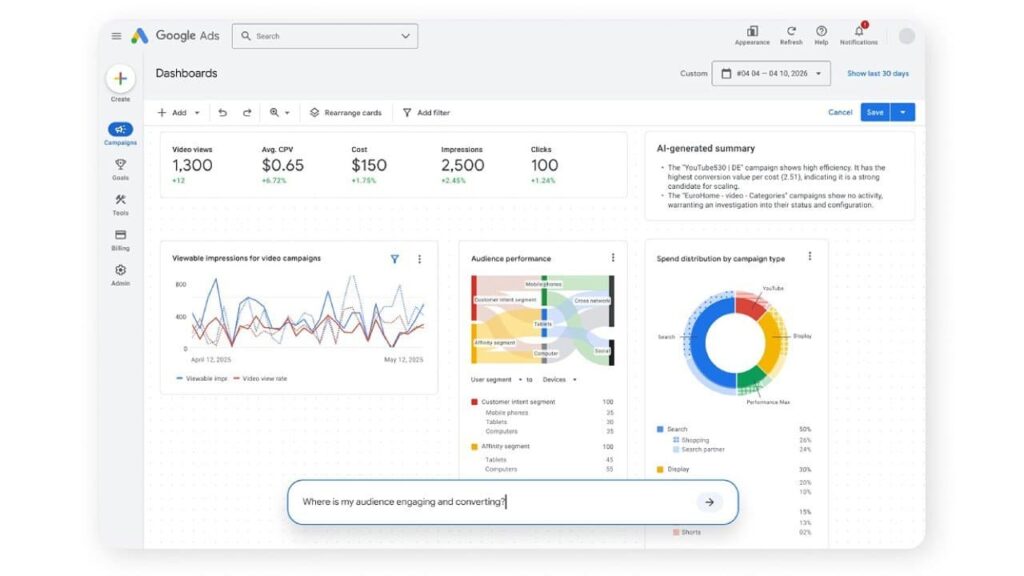
What’s happening. Google Ads is rolling out a new Dashboards feature that lets advertisers explore performance data using charts, graphs and tables, powered by Gemini.
Users can customise views simply by typing prompts, with the dashboard updating in real time based on their queries.

Why we care. Data analysis in Google Ads has traditionally required manual setup and navigation across reports.
This update shifts that workflow toward a more conversational model, where advertisers ask questions and get instant visual answers.
Zoom in. Dashboards will display key metrics like impressions, clicks, video views and cost, alongside visual breakdowns of performance across devices, audiences and campaign types.
The goal is to give advertisers a clearer, faster way to understand what’s happening in their accounts.
What to watch. How widely advertisers adopt prompt-based reporting, and whether this reduces reliance on custom-built reports and external analytics tools.
What’s next. Google says more details will be shared at Google Marketing Live.
Bottom line. Google is turning reporting into a conversation — using AI to help advertisers get answers faster and act on them sooner.