Key Takeaways
As organizations scale, they can struggle with “visibility gaps,” failing to pinpoint why a system is slow, if their data is under attack, or whether employees are actually using the tools provided. Without these insights, technical and leadership teams are forced to make critical infrastructure and training decisions based on anecdotal feedback and guesswork rather than data.
As a result, performance slowdowns, risky user behavior, and inefficient integrations often go unnoticed until they impact productivity, security, compliance, or customer trust. Ultimately, organizations risk investing in features and training that don’t drive real usage or business value. To address this, we need to replace these blind spots with a clear, data-driven perspective.
Introducing New Event Log Objects Analytics
We’re excited to announce a powerful new suite of out-of-the-box dashboards available with Event Monitoring called Event Log Objects Analytics. This unified lens transforms our approach from reactive fixes to proactive management, providing an unfiltered view of org activity in minutes and a better understanding of the security, health, and usage of the platform. These dashboards translate raw event log data into clear, actionable business intelligence across three critical pillars of your Salesforce org: data security, platform performance, and user adoption.
Here are the primary benefits of using these dashboards:
Enhanced security and compliance
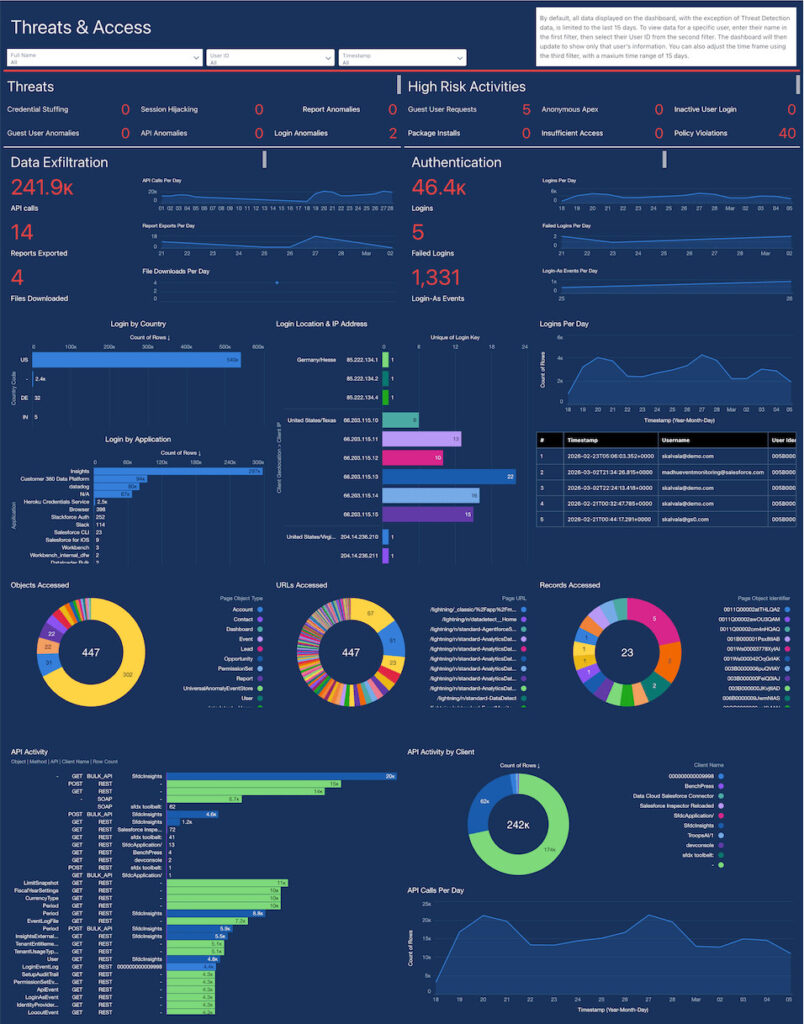
The new security dashboards (like ‘Threats & Access’) provide a unified view to monitor suspicious activity and conduct forensic investigations. We can track data exfiltration attempts (like report exports or bulk API calls), high-risk user actions, and potential threats, enabling us to respond to security incidents faster and simplify audits.
Actionable Insights: Features the Threats & Access dashboard, which monitors for threats like session hijacking, credential stuffing, and high-risk activities.
Use Case: A Salesforce admin needs to perform a scope assessment after a security incident occurs. The admin also wants to filter by a specific user in a specified timeframe to determine if the user has been compromised. The admin uses the ‘Threat and Access Dashboard’ to understand exactly what happened and assess which data was accessed.

Proactive performance optimization
With the new dashboards, we can now proactively identify and troubleshoot performance bottlenecks, either overall or down to a specific user. You can pinpoint specific slow Lightning pages, inefficient Apex code, and problematic API integrations, allowing you to optimize the user experience and ensure platform stability.
Actionable Insights: Includes a high-level summary of errors and recent trends, as well as dedicated dashboards for Lightning Performance (focusing on page load times), Apex Performance (for optimizing code and queries), and an API Summary.
Use Case: A Salesforce developer wants to analyze performance to identify what is slowing down application performance. The developer uses the ‘Performance and Health’ Dashboard to identify errors and troubleshoot performance issues in one consolidated view.
Deep user adoption insights
We can finally move beyond basic login metrics. The ‘User Activity & Journeys’ dashboard shows us how users navigate the application, which features they use most, and where they get stuck. This is invaluable for driving adoption, refining training, and making data-driven decisions for future enhancements.
Actionable Insights: Includes the User Activity & Journeys dashboard to track the paths users take through the application.
Use Case: A Salesforce product owner looking to drive adoption wants to identify low-adopter groups and features that are not utilized. The product owner uses the Adoption and User Journeys dashboard to understand usage patterns and create targeted strategies to improve engagement.
To see these new dashboards in action, please ensure you have CRM analytics enabled and follow these instructions for setup to get started.