Traditional alerting systems often force a compromise: you can either alert immediately on simple, noisy log events, or monitor rigid, pre-configured metrics that fail when faced with data with many unique answers like user sessions or IP addresses. But the most critical system issues — like a 20% spike in error rates for a specific customer or a latency anomaly correlated with database timeouts — are hidden in the aggregates and relationships between these signals.
Recently, we announced that you can now use SQL to query logs and traces in Observability Analytics (formerly Log Analytics). But the story gets better. You can also use SQL to create alerts in Observability Analytics. By bringing SQL directly to your alerting engine, you can write complex analytical queries over logs and traces and turn them into alerts. Whether you need to calculate error percentages, analyze high-cardinality dimensions, or JOIN logs and traces, SQL alerting helps you go from basic threshold monitoring to deep, contextual detection that goes beyond the capabilities of traditional alerting systems. SQL alerting is now in preview.

How SQL-based alerting works
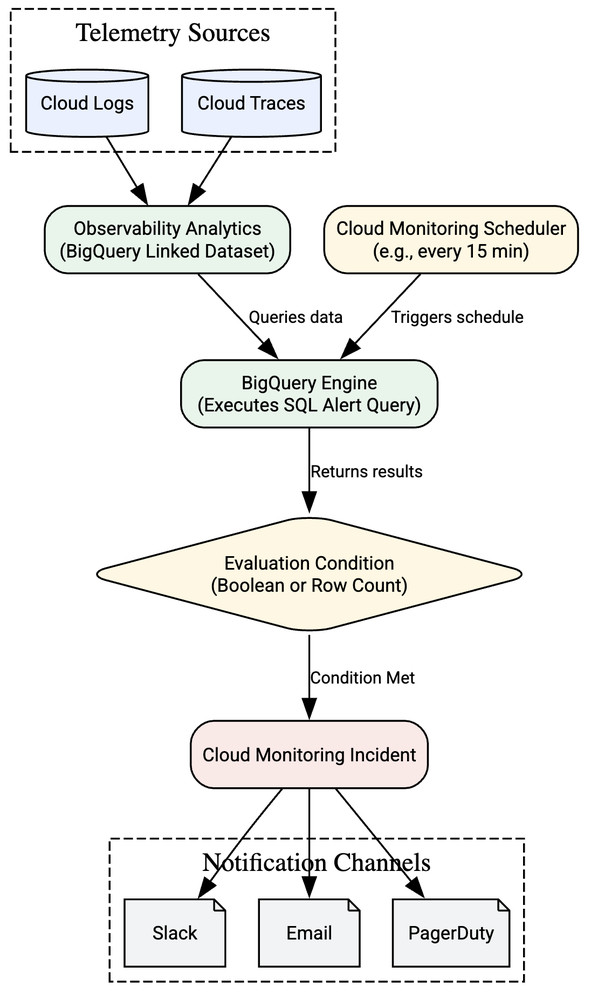
SQL alerting in Observability Analytics is available as part of Cloud Monitoring. An alerting policy runs your SQL query on a schedule you define (for example, every 10 minutes). It automatically applies a “lookback window” to your query, so it only analyzes the log entries or trace spans it received since the last time it ran.
If the results of your query meet the condition you set, Cloud Monitoring creates an incident and sends a notification to your chosen channels, like email, Slack, or PagerDuty.
Please note that because SQL-based alerting uses BigQuery to process telemetry data, query executions are billed through BigQuery under your standard on-demand pricing or BigQuery reservations.
Two ways to trigger an alert
You can choose between two types of alert conditions.
- Row count threshold: This is the simplest option. The alert fires if your query returns a number of rows that is greater than, equal to, or less than a threshold you set. This is perfect for “alert me if more than 10 users have failed logins” scenarios.
- Boolean: This is the most powerful option. The alert fires if your query returns any row where a specific column you define has a value of true. This lets you build complex logic, like calculating percentages, directly in your SQL query.
Example 1: Alerting on payment gateway failures (row count)
Scenario: Imagine that you’re an e-commerce operator, and you want to be alerted immediately if your payment gateway is experiencing systemic outages, while ignoring occasional, normal card declines (like an incorrect PIN).
To do this, you can write a query to filter for log entries indicating gateway timeouts, and use a row count threshold to trigger the alert only if the volume of these errors spikes.
- code_block
- <ListValue: [StructValue([(‘code’, “SELECTrn JSON_VALUE(json_payload.transaction_id) AS transaction_id,rn JSON_VALUE(json_payload.error_code) AS error_codernFROMrn `my-project-id.my-dataset.my-log-view`rnWHERErn JSON_VALUE(json_payload.status) = ‘FAILED’rn — Filter for systemic gateway issues, not user-input errors like WRONG_PINrn AND JSON_VALUE(json_payload.failure_reason) = ‘GATEWAY_TIMEOUT'”), (‘language’, ”), (‘caption’, <wagtail.rich_text.RichText object at 0x7f5473f5f520>)])]>
Alert configuration:
- Condition type: Row count threshold
- Trigger condition: Fired when row counts greater than (
>) 10 - Evaluation window / lookback: 5 minutes (checks the last 5 minutes of data on your defined schedule)
Example 2: Alerting on agent latency (traces)
Scenario: You’re an AI platform engineer, and you want to ensure your multi-step AI agents are responding within acceptable time limits. You want to monitor the 99th percentile (p99) latency of the orchestrator service and get alerted if performance degrades.
To do this, you can write a SQL query against your trace data that calculates the p99 latency for all services and returns true if your agent-orchestrator exceeds 5 seconds (5000 milliseconds).
- code_block
- <ListValue: [StructValue([(‘code’, ‘WITH latency_data AS (rn SELECTrn APPROX_QUANTILES(duration_nano, 100)[OFFSET(99)] / 1000000 AS p99_msrn FROMrn `my-project-id.us._Trace.Spans._AllSpans`rn WHERErn — Examine rows produced by the agent-orchestratorrn JSON_VALUE(resource.attributes, ‘$.”service.name”‘) = ‘agent-orchestrator’rn GROUP BYrn service_namern)rnSELECTrn “agent-orchestrator” AS service_name,rn p99_ms,rn — Boolean logic: Alert if p99 exceeds 5000msrn (p99_ms > 5000) AS has_latency_spikernFROMrn latency_data’), (‘language’, ”), (‘caption’, <wagtail.rich_text.RichText object at 0x7f5473f5f730>)])]>
Alert configuration:
-
Condition type: Boolean
-
Target column: has_latency_spike
-
Trigger condition: Fired when the query returns any row where this column evaluates to true.
-
Evaluation window / lookback: 10 minutes (or your preferred scheduling interval)
Before you begin
Before you can create a SQL-based alert, you need to set up a few things:
-
Analytics enabled:
-
For logs: Upgrade your log bucket to use Observability Analytics (if not already updated).
-
For traces: Cloud Trace must be collected and stored in your project.
Linked BigQuery dataset: Create a linked BigQuery dataset for the telemetry source (either the log bucket or the trace dataset). SQL-based alerts query the data through this BigQuery link.
IAM permissions:
-
Grant the IAM roles necessary to create an SQL-based alert policy: Monitoring AlertPolicy Editor and Logging SqlAlert Writer (applies to both log and trace alerts).
Notification channels: Configure the notification channels (like email or Slack) where you want to receive alerts.
How to create your alert
Creating a sql-based alert policy is straightforward:
-
Navigate to Observability Analytics in the Google Cloud console.
-
Compose and validate your SQL query.
-
Select the Run on BigQuery query engine in the UI.
-
Click the Create alert button from the results toolbar.
-
Define your condition (row count or boolean) and your evaluation schedule.
-
Add your notification channels, give your alert a clear name, and click Save.
For Infrastructure as Code (IaC) pipelines, you can also configure alerts via the API and Terraform.
Get started
Ready to build more powerful, insightful alerts? Open the Observability Analytics page in the console and try writing your first SQL query today. You can find more details and advanced examples in the official documentation.