This post is cowritten with John Gilhuly from Arize AI.
With Amazon Bedrock Agents, you can build and configure autonomous agents in your application. An agent helps your end-users complete actions based on organization data and user input. Agents orchestrate interactions between foundation models (FMs), data sources, software applications, and user conversations. In addition, agents automatically call APIs to take actions and invoke knowledge bases to supplement information for these actions. By integrating agents, you can accelerate your development effort to deliver generative AI applications. With agents, you can automate tasks for your customers and answer questions for them. For example, you can create an agent that helps customers process insurance claims or make travel reservations. You don’t have to provision capacity, manage infrastructure, or write custom code. Amazon Bedrock manages prompt engineering, memory, monitoring, encryption, user permissions, and API invocation.
AI agents represent a fundamental shift in how applications make decisions and interact with users. Unlike traditional software systems that follow predetermined paths, AI agents employ complex reasoning that often operates as a “black box.” Monitoring AI agents presents unique challenges for organizations seeking to maintain reliability, efficiency, and optimal performance in their AI implementations.
Today, we’re excited to announce a new integration between Arize AI and Amazon Bedrock Agents that addresses one of the most significant challenges in AI development: observability. Agent observability is a crucial aspect of AI operations that provides deep insights into how your Amazon Bedrock agents perform, interact, and execute tasks. It involves tracking and analyzing hierarchical traces of agent activities, from high-level user requests down to individual API calls and tool invocations. These traces form a structured tree of events, helping developers understand the complete journey of user interactions through the agent’s decision-making process. Key metrics that demand attention include response latency, token usage, runtime exceptions, and inspect function calling. As organizations scale their AI implementations from proof of concept to production, understanding and monitoring AI agent behavior becomes increasingly critical.
The integration between Arize AI and Amazon Bedrock Agents provides developers with comprehensive observability tools for tracing, evaluating, and monitoring AI agent applications. This solution delivers three primary benefits:
- Comprehensive traceability – Gain visibility into every step of your agent’s execution path, from initial user query through knowledge retrieval and action execution
- Systematic evaluation framework – Apply consistent evaluation methodologies to measure and understand agent performance
- Data-driven optimization – Run structured experiments to compare different agent configurations and identify optimal settings
The Arize AI service is available in two versions:
- Arize AX – An enterprise solution offering advanced monitoring capabilities
- Arize Phoenix – An open source service making tracing and evaluation accessible to developers
In this post, we demonstrate the Arize Phoenix system for tracing and evaluation. Phoenix can run on your local machine, a Jupyter notebook, a containerized deployment, or in the cloud. We explore how this integration works, its key features, and how you can implement it in your Amazon Bedrock Agents applications to enhance observability and maintain production-grade reliability.
Solution overview
Large language model (LLM) tracing records the paths taken by requests as they propagate through multiple steps or components of an LLM application. It improves the visibility of your application or system’s health and makes it possible to debug behavior that is difficult to reproduce locally. For example, when a user interacts with an LLM application, tracing can capture the sequence of operations, such as document retrieval, embedding generation, language model invocation, and response generation, to provide a detailed timeline of the request’s execution.
For an application to emit traces for analysis, the application must be instrumented. Your application can be manually instrumented or be automatically instrumented. Arize Phoenix offers a set of plugins (instrumentors) that you can add to your application’s startup process that perform automatic instrumentation. These plugins collect traces for your application and export them (using an exporter) for collection and visualization. The Phoenix server is a collector and UI that helps you troubleshoot your application in real time. When you run Phoenix (for example, the px.launch_app() container), Phoenix starts receiving traces from an application that is exporting traces to it. For Phoenix, the instrumentors are managed through a single repository called OpenInference. OpenInference provides a set of instrumentations for popular machine learning (ML) SDKs and frameworks in a variety of languages. It is a set of conventions and plugins that is complimentary to OpenTelemetry and online transaction processing (OLTP) to enable tracing of AI applications. Phoenix currently supports OTLP over HTTP.
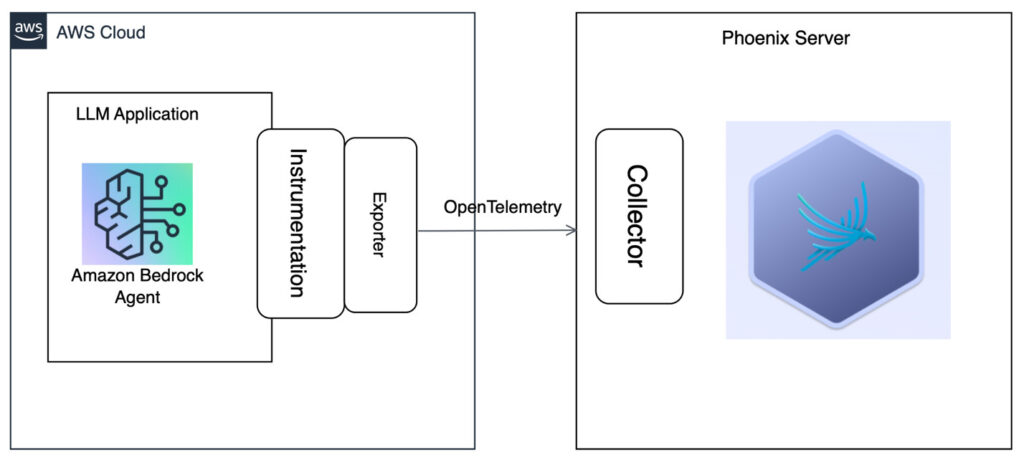
For AWS, Boto3 provides Python bindings to AWS services, including Amazon Bedrock, which provides access to a number of FMs. You can instrument calls to these models using OpenInference, enabling OpenTelemetry-aligned observability of applications built using these models. You can also capture traces on invocations of Amazon Bedrock agents using OpenInference and view them in Phoenix.The following high-level architecture diagram shows an LLM application created using Amazon Bedrock Agents, which has been instrumented to send traces to the Phoenix server.

In the following sections, we demonstrate how, by installing the openinference-instrumentation-bedrock library, you can automatically instrument interactions with Amazon Bedrock or Amazon Bedrock agents for observability, evaluation, and troubleshooting purposes in Phoenix.
Prerequisites
To follow this tutorial, you must have the following:
- An AWS account with access to Amazon Bedrock.
- An Amazon Bedrock agent. For instructions to create an agent, refer to Create and configure agent manually. The following GitHub repo demonstrates how to create an agent using infrastructure as code (IaC), implemented through AWS Cloud Development Kit (AWS CDK) Python APIs.
- An Arize account from where you can then get a Phoenix API key (available at app.phoenix.arize.com).
You can also clone the GitHub repo locally to run the Jupyter notebook yourself:
git clone https://github.com/awslabs/amazon-bedrock-agent-samples.git
Install required dependencies
Begin by installing the necessary libraries:
%pip install -r requirements.txt — quiet
Next, import the required modules:
The arize-phoenix-otel package provides a lightweight wrapper around OpenTelemetry primitives with Phoenix-aware defaults. These defaults are aware of environment variables you must set to configure Phoenix in the next steps, such as:
PHOENIX_COLLECTOR_ENDPOINTPHOENIX_PROJECT_NAMEPHOENIX_CLIENT_HEADERSPHOENIX_API_KEY
Configure the Phoenix environment
Set up the Phoenix Cloud environment for this tutorial. Phoenix can also be self-hosted on AWS instead.
Connect your notebook to Phoenix with auto-instrumentation enabled:
The auto_instrument parameter automatically locates the openinference-instrumentation-bedrock library and instruments Amazon Bedrock and Amazon Bedrock Agent calls without requiring additional configuration. Configure metadata for the span:
Set up an Amazon Bedrock session and agent
Before using Amazon Bedrock, make sure that your AWS credentials are configured correctly. You can set them up using the AWS Command Line Interface (AWS CLI) or by setting environment variables:
We assume you’ve already created an Amazon Bedrock agent. To configure the agent, use the following code:
Before proceeding to your next step, you can validate whether invoke agent is working correctly. The response is not important; we are simply testing the API call.
Run your agent with tracing enabled
Create a function to run your agent and capture its output:
Test your agent with a few sample queries:
You should replace these queries with the queries that your application is built for. After executing these commands, you should see your agent’s responses in the notebook output. The Phoenix instrumentation is automatically capturing detailed traces of these interactions, including knowledge base lookups, orchestration steps, and tool calls.
View captured traces in Phoenix
Navigate to your Phoenix dashboard to view the captured traces. You will see a comprehensive visualization of each agent invocation, including:
- The full conversation context
- Knowledge base queries and results
- Tool or action group calls and responses
- Agent reasoning and decision-making steps
Phoenix’s tracing and span analysis capabilities are useful during the prototyping and debugging stages. By instrumenting application code with Phoenix, teams gain detailed insights into the execution flow, making it straightforward to identify and resolve issues. Developers can drill down into specific spans, analyze performance metrics, and access relevant logs and metadata to streamline debugging efforts. With Phoenix’s tracing capabilities, you can monitor the following:
- Application latency – Identify latency bottlenecks and address slow invocations of LLMs, retrievers, and other components within your application, enabling you to optimize performance and responsiveness.
- Token usage – Gain a detailed breakdown of token usage for your LLM calls, so you can identify and optimize the most expensive LLM invocations.
- Runtime exceptions – Capture and inspect critical runtime exceptions, such as rate-limiting events, that can help you proactively address and mitigate potential issues.
- Retrieved documents – Inspect the documents retrieved during a retriever call, including the score and order in which they were returned, to provide insight into the retrieval process.
- Embeddings – Examine the embedding text used for retrieval and the underlying embedding model, so you can validate and refine your embedding strategies.
- LLM parameters – Inspect the parameters used when calling an LLM, such as temperature and system prompts, to facilitate optimal configuration and debugging.
- Prompt templates – Understand the prompt templates used during the prompting step and the variables that were applied, so you can fine-tune and improve your prompting strategies.
- Tool descriptions – View the descriptions and function signatures of the tools your LLM has been given access to, in order to better understand and control your LLM’s capabilities.
- LLM function calls – For LLMs with function call capabilities (such as Anthropic’s Claude, Amazon Nova, or Meta’s Llama), you can inspect the function selection and function messages in the input to the LLM. This can further help you debug and optimize your application.
The following screenshot shows the Phoenix dashboard for the Amazon Bedrock agent, showing the latency, token usage, total traces.

You can choose one of the traces to drill down to the level of the entire orchestration.

Evaluate the agent in Phoenix
Evaluating any AI application is a challenge. Evaluating an agent is even more difficult. Agents present a unique set of evaluation pitfalls to navigate. A common evaluation metric for agents is their function calling accuracy, in other words, how well they do at choosing the right tool for the job. For example, agents can take inefficient paths and still get to the right solution. How do you know if they took an optimal path? Additionally, bad responses upstream can lead to strange responses downstream. How do you pinpoint where a problem originated? Phoenix also includes built-in LLM evaluations and code-based experiment testing. An agent is characterized by what it knows about the world, the set of actions it can perform, and the pathway it took to get there. To evaluate an agent, you must evaluate each component. Phoenix has built evaluation templates for every step, such as:
You can evaluate the individual skills and response using normal LLM evaluation strategies, such as retrieval evaluation, classification with LLM judges, hallucination, or Q&A correctness. In this post, we demonstrate evaluation of agent function calling. You can use the Agent Function Call eval to determine how well a model selects a tool to use, extracts the right parameters from the user query, and generates the tool call code. Now that you’ve traced your agent in the previous step, the next step is to add evaluations to measure its performance. A common evaluation metric for agents is their function calling accuracy (how well they do at choosing the right tool for the job).Complete the following steps:
- Up until now, you have just used the lighter-weight Phoenix OTEL tracing library. To run evals, you must to install the full library:
!pip install -q arize-phoenix — quiet
- Import the necessary evaluation components:
The following is our agent function calling prompt template:
- Because we are only evaluating the inputs, outputs, and function call columns, let’s extract those into a simpler-to-use dataframe. Phoenix provides a method to query your span data and directly export only the values you care about:
- The next step is to prepare these traces into a dataframe with columns for input, tool call, and tool definitions. Parse the JSON input and output data to create these columns:
- Apply the function to each row of
trace_df.output.value:
- Add tool definitions for evaluation:
Now with your dataframe prepared, you can use Phoenix’s built-in LLM-as-a-Judge template for tool calling to evaluate your application. The following method takes in the dataframe of traces to evaluate, our built-in evaluation prompt, the eval model to use, and a rails object to snap responses from our model to a set of binary classification responses. We also instruct our model to provide explanations for its responses.
- Run the tool calling evaluation:
We use the following parameters:
- df – A dataframe of cases to evaluate. The dataframe must have columns to match the default template.
- question – The query made to the model. If you exported spans from Phoenix to evaluate, this will be the
llm.input_messagescolumn in your exported data. - tool_call – Information on the tool called and parameters included. If you exported spans from Phoenix to evaluate, this will be the
llm.function_callcolumn in your exported data.
- Finally, log the evaluation results to Phoenix:
After running these commands, you will see your evaluation results on the Phoenix dashboard, providing insights into how effectively your agent is using its available tools.
The following screenshot shows how the tool calling evaluation attribute shows up when you run the evaluation.

When you expand the individual trace, you can observe that the tool calling evaluation adds a score of 1 if the label is correct. This means that agent has responded correctly.

Conclusion
As AI agents become increasingly prevalent in enterprise applications, effective observability is crucial for facilitating their reliability, performance, and continuous improvement. The integration of Arize AI with Amazon Bedrock Agents provides developers with the tools they need to build, monitor, and enhance AI agent applications with confidence. We’re excited to see how this integration will empower developers and organizations to push the boundaries of what’s possible with AI agents.
Stay tuned for more updates and enhancements to this integration in the coming months. To learn more about Amazon Bedrock Agents and the Arize AI integration, refer to the Phoenix documentation and Integrating Arize AI and Amazon Bedrock Agents: A Comprehensive Guide to Tracing, Evaluation, and Monitoring.
About the Authors
 Ishan Singh is a Sr. Generative AI Data Scientist at Amazon Web Services, where he helps customers build innovative and responsible generative AI solutions and products. With a strong background in AI/ML, Ishan specializes in building generative AI solutions that drive business value. Outside of work, he enjoys playing volleyball, exploring local bike trails, and spending time with his wife and dog, Beau.
 John Gilhuly is the Head of Developer Relations at Arize AI, focused on AI agent observability and evaluation tooling. He holds an MBA from Stanford and a B.S. in C.S. from Duke. Prior to joining Arize, John led GTM activities at Slingshot AI, and served as a venture fellow at Omega Venture Partners. In his pre-AI life, John built out and ran technical go-to-market teams at Branch Metrics.
 Richa Gupta is a Sr. Solutions Architect at Amazon Web Services. She is passionate about architecting end-to-end solutions for customers. Her specialization is machine learning and how it can be used to build new solutions that lead to operational excellence and drive business revenue. Prior to joining AWS, she worked in the capacity of a Software Engineer and Solutions Architect, building solutions for large telecom operators. Outside of work, she likes to explore new places and loves adventurous activities.
 Aris Tsakpinis is a Specialist Solutions Architect for Generative AI, focusing on open weight models on Amazon Bedrock and the broader generative AI open source landscape. Alongside his professional role, he is pursuing a PhD in Machine Learning Engineering at the University of Regensburg, where his research focuses on applied natural language processing in scientific domains.
 Yanyan Zhang is a Senior Generative AI Data Scientist at Amazon Web Services, where she has been working on cutting-edge AI/ML technologies as a Generative AI Specialist, helping customers use generative AI to achieve their desired outcomes. Yanyan graduated from Texas A&M University with a PhD in Electrical Engineering. Outside of work, she loves traveling, working out, and exploring new things.
 Mani Khanuja is a Principal Generative AI Specialist SA and author of the book Applied Machine Learning and High-Performance Computing on AWS. She leads machine learning projects in various domains such as computer vision, natural language processing, and generative AI. She speaks at internal and external conferences such AWS re:Invent, Women in Manufacturing West, YouTube webinars, and GHC 23. In her free time, she likes to go for long runs along the beach.
 Musarath Rahamathullah is an AI/ML and GenAI Solutions Architect at Amazon Web Services, focusing on media and entertainment customers. She holds a Master’s degree in Analytics with a specialization in Machine Learning. She is passionate about using AI solutions in the AWS Cloud to address customer challenges and democratize technology. Her professional background includes a role as a Research Assistant at the prestigious Indian Institute of Technology, Chennai. Beyond her professional endeavors, she is interested in interior architecture, focusing on creating beautiful spaces to live.